⏳ Mining deep into Data Mining - Statistics - PART I ⏳
Why do we have to know statistics?🤔
As mentioned in the previous posts, we live in the world of data from which we can derive insightful information. Thus, Statistics play a vital role in processing and analyzing the data to make decisions and predictions.
What actually is statistics? 👀 Let's get more technical
Statistics is the discipline that concerns the collection, organization, analysis, interpretation, and presentation of data. There are two types or classes of statistics.
👉 Descriptive statistics
👉 Inferential statistics
Descriptive Statistics 😀
👉 Descriptive statistics focuses more on analyzing, summarizing, and organizing data in the form of numbers or graphs.
👉 Bar plots, histograms, pie-charts are used in visualizing descriptive data and determining PDF (probability density function), CDF (cumulative distribution function), Normal distribution.
👉 Measure of central tendency is determined by mean, median, and mode.
👉 Measure of variance - variance and standard deviation.
How to differentiate descriptive and inferential statistics? 🤔
A suitable example would be the Election Exit poll data (ie) The poll of voters taken after they have exited the polling stations to predict or pre-determine the chances of the winning party.
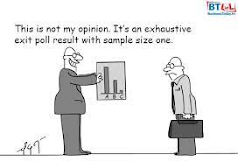
👉 Consider any state in India, say XYZ with a population of 7 million people. Once the voting process commences, the exit polls provide predictive data about the performance of each party.
👉 Instead of considering the entire 7 million population, a sample mass of people is considered say 10,000 in each area and the data is collected.
👉 From the data, say party_1 has a majority in area_1, party_2 has a majority in area_2 (ie) we infer a piece of information by testing the sample data to obtain the information.
👉 In inferential statistics, Confidence interval plays an important role. It denotes the probability of any parameter (in our case, voting count) will fall between a pair of values around the mean.
👉 Hypothesis testings - such as Z test, T-test, Chi-square tests are performed here.
Population vs Sample 💥
Let us consider a problem that is determined to find the Average height of all the people of a state XYZ. Let the total population count of the state be 1 million.
👉 Population is defined to be the total observations present (ie) the entire 1 million data. It is denoted by N.
👉 Population mean (μ) is the average of the group of observations in the population. In our case, it is the average height of all the people.

Let i denote every instance or observation and h denotes the height of an observation.
👉 It would be tedious to handle the entire population data, thus a sample of data is considered for better observation and analytics.
👉 Sample is any subset of the population data. In our example, out of the 1 million population, a sample of 50,000 observations can be considered. It is generally denoted by 'n'.
👉 Sample Mean ( x̅) is the average of the group of observations in the sample. In our case, it is the average height of people in the sample data.

Let 'i' denote every instance or observation and 'h' denote the height of an observation.
Random Variables
First, let's understand what a variable is. In programming languages, a variable is a name given to a memory location or we can call it a placeholder to store some values.
Similarly, a random variable is the one that is used to hold a value and the value is initially unknown. Simple as that !!.
Types of Random variable
👉 Discrete random variable - It is a variable that holds a whole number or a finite floating-point value. It must not be continuously finite.
Example:
👉 The total number of employees in a company, the average salary of an employee, floating values such as 0.3, 0.0025 are discrete.
👉 3.142356.... cannot be defined as discrete.
👉 Continuous random variable - Any value within the given range is acceptable. Be it a whole number or a decimal number.
Example:
👉 The height of a person may range from 150 to 170 cm. So we may assume any values such as 168.98, 159, 144.345 cms.
Let's explore more about distributions in the successive posts.


Comments
Post a Comment